There is only 2 things that matter to shareholders as well as the future of elara:
organic revenue growth
margin expansion over time (% year over year OR month over month)
If we want to make 10 million a year what is that broken down monthly and who would we need to have on board to sustain that growth?
Then 50 million, 100 million, etc.
The most important question… how do we get to that number in profit? or gross margins? and NOT revenue?
THIS is where the magic begins.
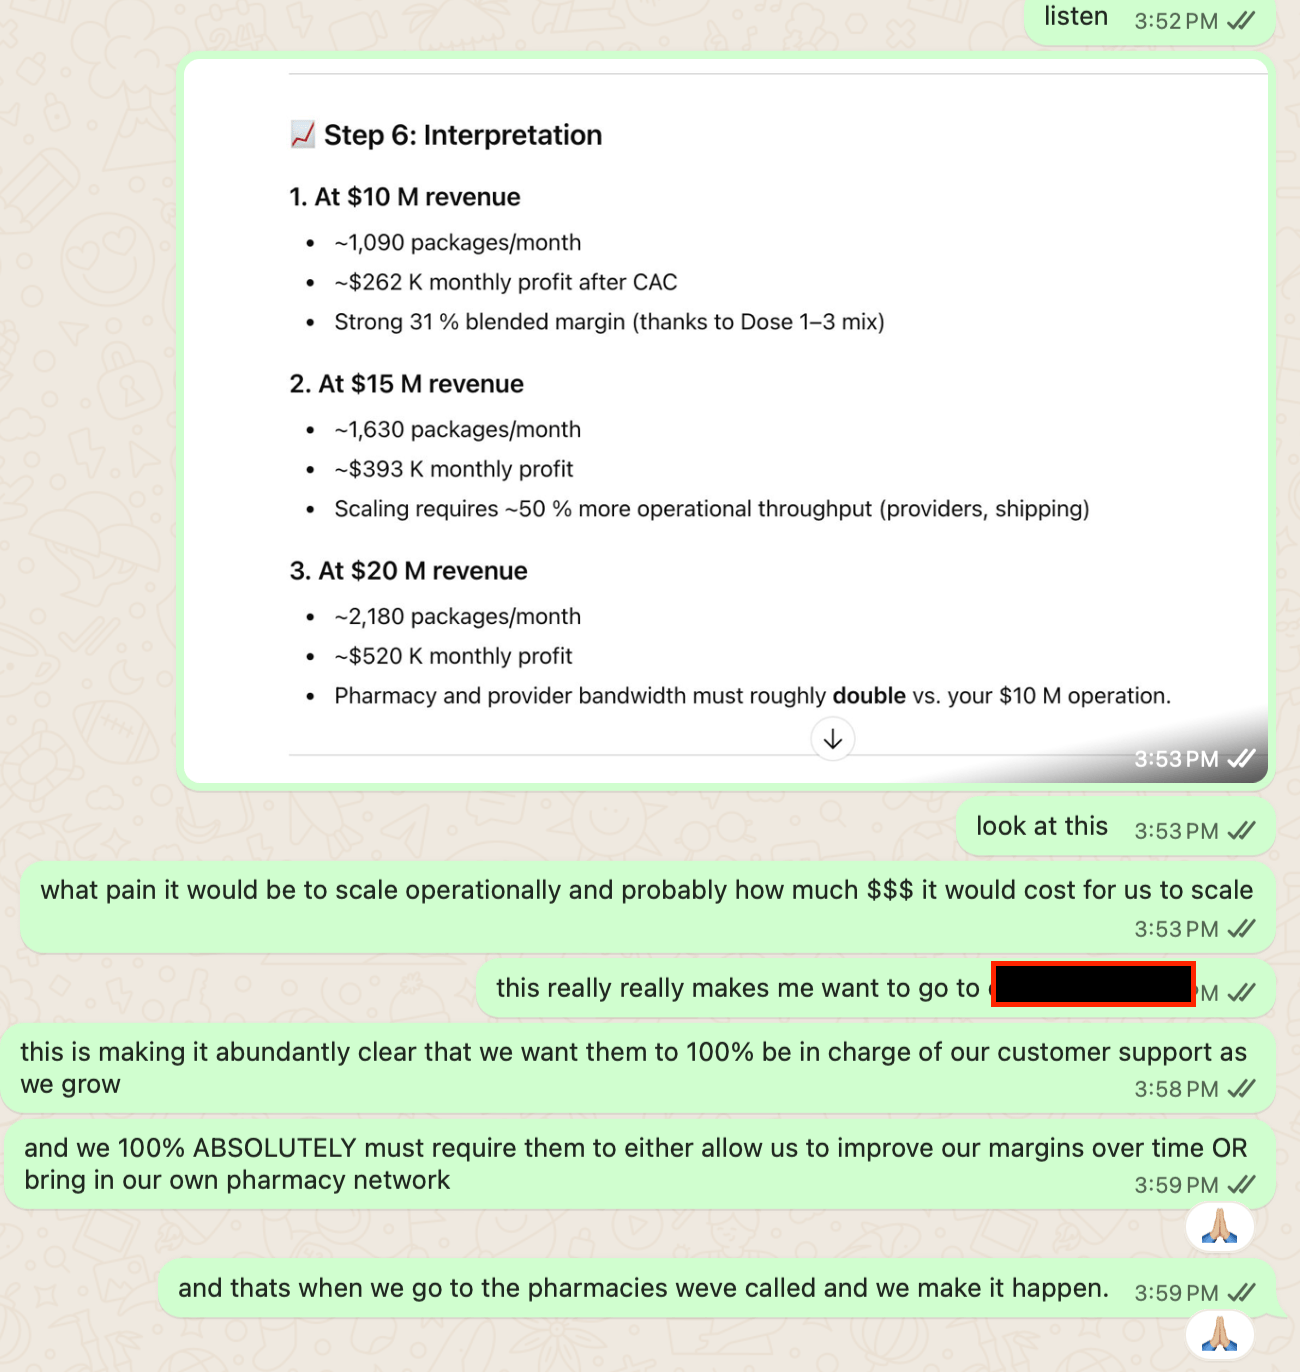
Who do we need on the team to make this happen? And what company do we want to be partnered with to ensure the sustainability of this growth?
Essentially right now with our current margins we would need to be making around $833,000/month.
For my 3-month pricing ($765) and per-dose profit after $100 CAC as the base unit economics.
Annual Revenue | Packages / Year | CAC Spend (@ $100 each) | Net Profit (after CAC) | Net Margin | Monthly Profit |
|---|---|---|---|---|---|
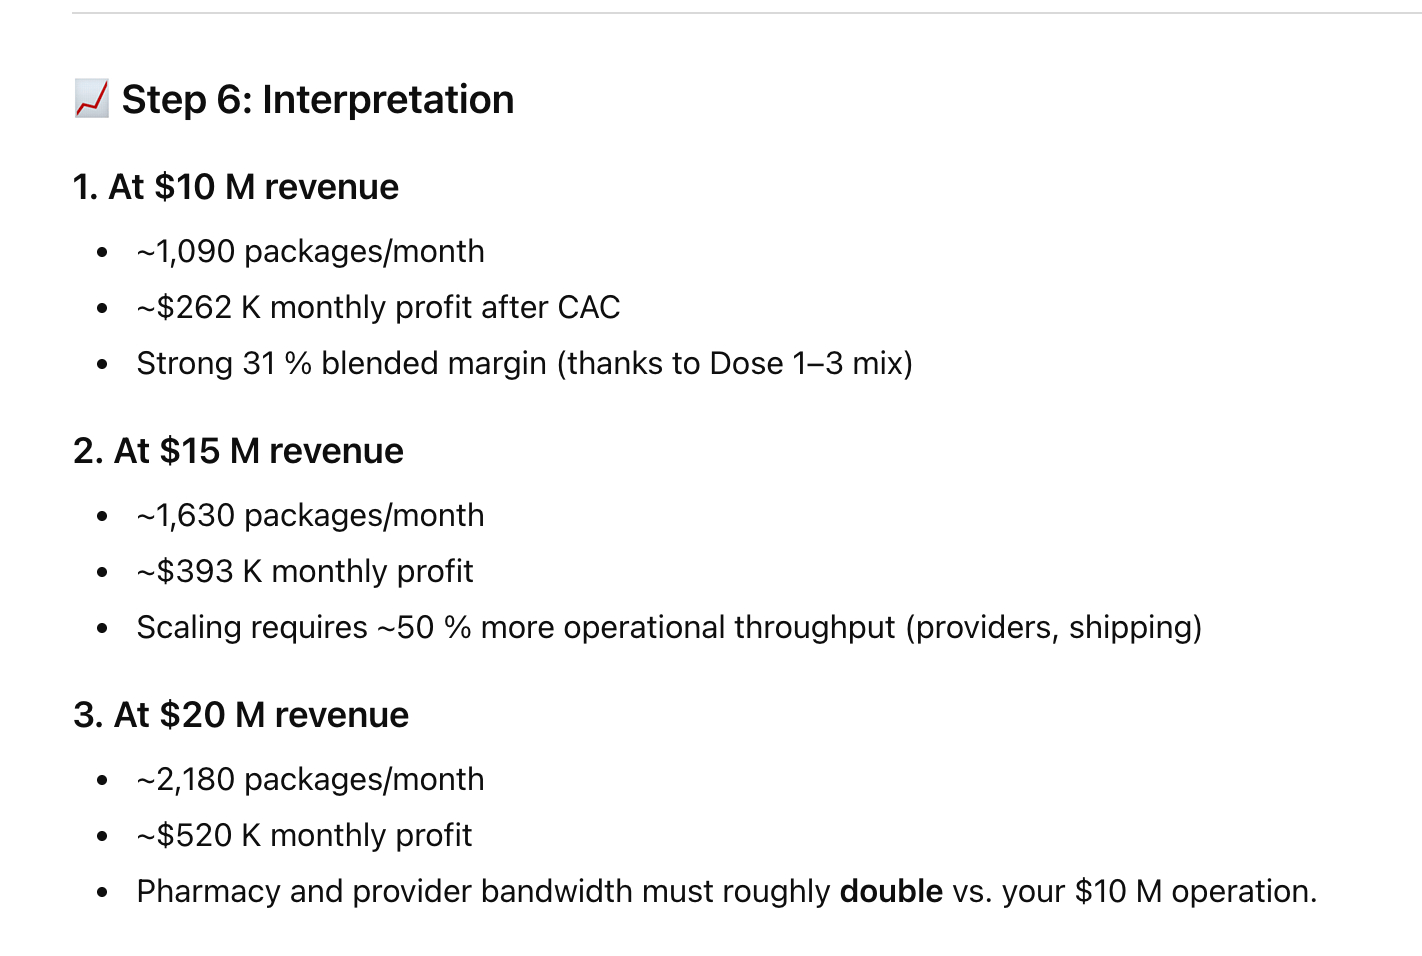
$10 M | 13,072 | $1.31 M | $3.14 M | 31.4 % | $262 K / mo |
$15 M | 19,608 | $1.96 M | $4.71 M | 31.4 % | $393 K / mo |
$20 M | 26,144 | $2.61 M | $6.28 M | 31.4 % | $523 K / mo |


Our current Tirzepatide pricing is shit for monthly increase as well as quarterly.

Tirzepatide — 3-Month Package Breakdown (By Dose)
Dose | Pharmacy Cost | Total Cost (incl. dispense, ship, doctor, processing) | Price (3 mo) | Profit (before CAC) | Profit (after $100 CAC) | Margin (after CAC) | Monthly Equivalent |
|---|---|---|---|---|---|---|---|
Dose 1 | $190 | $273.83 | $765 | $491.18 | $391.18 | 51.1 % | $130.39 |
Dose 2 | $310 | $393.83 | $765 | $371.18 | $271.18 | 35.4 % | $90.39 |
Dose 3 | $350 | $433.83 | $765 | $331.18 | $231.18 | 30.2 % | $77.06 |
Dose 4 | $410 | $493.83 | $765 | $271.18 | $171.18 | 22.4 % | $57.06 |
Dose 5 | $500 | $583.83 | $765 | $181.18 | $81.18 | 10.6 % | $27.06 |
Dose 6 | $530 | $613.83 | $765 | $151.18 | $51.18 | 6.7 % | $17.06 |
1. Profit progression
Profit declines steadily as dose (and pharmacy ingredient cost) rises.
Entry dose 1 yields $391 net per 3-month cycle, while maintenance dose 6 yields only $51 net.
2. Blended average (Dose 2–6)
Metric | Value |
|---|---|
Avg 3-mo Cost | $443 |
Avg 3-mo Profit (before CAC) | $281 |
Avg 3-mo Profit (after CAC) | $181 |
Avg Margin (after CAC) | 23.7 % |
3. CAC efficiency
CAC is paid once, so by the second quarter (repeat purchase), profit improves by ~$100 per patient.
Lifetime Value (two 3-month cycles) roughly doubles net profit with no extra CAC.
4. Scaling implications
Target | Required 3-mo Packages | CAC Spend | Est. Profit (after CAC, using blended avg $181) |
|---|---|---|---|
$10 M / yr revenue | ~13,070 packages | ~$1.31 M | $2.36 M profit (~23.5 %) |
What needs to be fixed? Pricing power: A small $20 price lift (+2.6 %) restores 1–2 margin points at high doses. Ideally, it would be more than $25.
Tier | Annual Rev | Monthly Rev | Net Profit | Net Margin | Packages / Mo |
|---|
Base | $10 M | $833 K | $3.1 M | 31 % | 1,090 |
Growth | $15 M | $1.25 M | $4.7 M | 31 % | 1,630 |
Scale | $20 M | $1.67 M | $6.3 M | 31 % | 2,180 |